- 1. API with NestJS #1. Controllers, routing and the module structure
- 2. API with NestJS #2. Setting up a PostgreSQL database with TypeORM
- 3. API with NestJS #3. Authenticating users with bcrypt, Passport, JWT, and cookies
- 4. API with NestJS #4. Error handling and data validation
- 5. API with NestJS #5. Serializing the response with interceptors
- 6. API with NestJS #6. Looking into dependency injection and modules
- 7. API with NestJS #7. Creating relationships with Postgres and TypeORM
- 8. API with NestJS #8. Writing unit tests
- 9. API with NestJS #9. Testing services and controllers with integration tests
- 10. API with NestJS #10. Uploading public files to Amazon S3
- 11. API with NestJS #11. Managing private files with Amazon S3
- 12. API with NestJS #12. Introduction to Elasticsearch
- 13. API with NestJS #13. Implementing refresh tokens using JWT
- 14. API with NestJS #14. Improving performance of our Postgres database with indexes
- 15. API with NestJS #15. Defining transactions with PostgreSQL and TypeORM
- 16. API with NestJS #16. Using the array data type with PostgreSQL and TypeORM
- 17. API with NestJS #17. Offset and keyset pagination with PostgreSQL and TypeORM
- 18. API with NestJS #18. Exploring the idea of microservices
- 19. API with NestJS #19. Using RabbitMQ to communicate with microservices
- 20. API with NestJS #20. Communicating with microservices using the gRPC framework
- 21. API with NestJS #21. An introduction to CQRS
- 22. API with NestJS #22. Storing JSON with PostgreSQL and TypeORM
- 23. API with NestJS #23. Implementing in-memory cache to increase the performance
- 24. API with NestJS #24. Cache with Redis. Running the app in a Node.js cluster
- 25. API with NestJS #25. Sending scheduled emails with cron and Nodemailer
- 26. API with NestJS #26. Real-time chat with WebSockets
- 27. API with NestJS #27. Introduction to GraphQL. Queries, mutations, and authentication
- 28. API with NestJS #28. Dealing in the N + 1 problem in GraphQL
- 29. API with NestJS #29. Real-time updates with GraphQL subscriptions
- 30. API with NestJS #30. Scalar types in GraphQL
- 31. API with NestJS #31. Two-factor authentication
- 32. API with NestJS #32. Introduction to Prisma with PostgreSQL
- 33. API with NestJS #33. Managing PostgreSQL relationships with Prisma
- 34. API with NestJS #34. Handling CPU-intensive tasks with queues
- 35. API with NestJS #35. Using server-side sessions instead of JSON Web Tokens
- 36. API with NestJS #36. Introduction to Stripe with React
- 37. API with NestJS #37. Using Stripe to save credit cards for future use
- 38. API with NestJS #38. Setting up recurring payments via subscriptions with Stripe
- 39. API with NestJS #39. Reacting to Stripe events with webhooks
- 40. API with NestJS #40. Confirming the email address
- 41. API with NestJS #41. Verifying phone numbers and sending SMS messages with Twilio
- 42. API with NestJS #42. Authenticating users with Google
- 43. API with NestJS #43. Introduction to MongoDB
- 44. API with NestJS #44. Implementing relationships with MongoDB
- 45. API with NestJS #45. Virtual properties with MongoDB and Mongoose
- 46. API with NestJS #46. Managing transactions with MongoDB and Mongoose
- 47. API with NestJS #47. Implementing pagination with MongoDB and Mongoose
- 48. API with NestJS #48. Definining indexes with MongoDB and Mongoose
- 49. API with NestJS #49. Updating with PUT and PATCH with MongoDB and Mongoose
- 50. API with NestJS #50. Introduction to logging with the built-in logger and TypeORM
- 51. API with NestJS #51. Health checks with Terminus and Datadog
- 52. API with NestJS #52. Generating documentation with Compodoc and JSDoc
- 53. API with NestJS #53. Implementing soft deletes with PostgreSQL and TypeORM
- 54. API with NestJS #54. Storing files inside a PostgreSQL database
- 55. API with NestJS #55. Uploading files to the server
- 56. API with NestJS #56. Authorization with roles and claims
- 57. API with NestJS #57. Composing classes with the mixin pattern
- 58. API with NestJS #58. Using ETag to implement cache and save bandwidth
- 59. API with NestJS #59. Introduction to a monorepo with Lerna and Yarn workspaces
- 60. API with NestJS #60. The OpenAPI specification and Swagger
- 61. API with NestJS #61. Dealing with circular dependencies
- 62. API with NestJS #62. Introduction to MikroORM with PostgreSQL
- 63. API with NestJS #63. Relationships with PostgreSQL and MikroORM
- 64. API with NestJS #64. Transactions with PostgreSQL and MikroORM
- 65. API with NestJS #65. Implementing soft deletes using MikroORM and filters
- 66. API with NestJS #66. Improving PostgreSQL performance with indexes using MikroORM
- 67. API with NestJS #67. Migrating to TypeORM 0.3
- 68. API with NestJS #68. Interacting with the application through REPL
- 69. API with NestJS #69. Database migrations with TypeORM
- 70. API with NestJS #70. Defining dynamic modules
- 71. API with NestJS #71. Introduction to feature flags
- 72. API with NestJS #72. Working with PostgreSQL using raw SQL queries
- 73. API with NestJS #73. One-to-one relationships with raw SQL queries
- 74. API with NestJS #74. Designing many-to-one relationships using raw SQL queries
- 75. API with NestJS #75. Many-to-many relationships using raw SQL queries
- 76. API with NestJS #76. Working with transactions using raw SQL queries
- 77. API with NestJS #77. Offset and keyset pagination with raw SQL queries
- 78. API with NestJS #78. Generating statistics using aggregate functions in raw SQL
- 79. API with NestJS #79. Implementing searching with pattern matching and raw SQL
- 80. API with NestJS #80. Updating entities with PUT and PATCH using raw SQL queries
- 81. API with NestJS #81. Soft deletes with raw SQL queries
- 82. API with NestJS #82. Introduction to indexes with raw SQL queries
- 83. API with NestJS #83. Text search with tsvector and raw SQL
- 84. API with NestJS #84. Implementing filtering using subqueries with raw SQL
- 85. API with NestJS #85. Defining constraints with raw SQL
- 86. API with NestJS #86. Logging with the built-in logger when using raw SQL
- 87. API with NestJS #87. Writing unit tests in a project with raw SQL
- 88. API with NestJS #88. Testing a project with raw SQL using integration tests
- 89. API with NestJS #89. Replacing Express with Fastify
- 90. API with NestJS #90. Using various types of SQL joins
- 91. API with NestJS #91. Dockerizing a NestJS API with Docker Compose
- 92. API with NestJS #92. Increasing the developer experience with Docker Compose
- 93. API with NestJS #93. Deploying a NestJS app with Amazon ECS and RDS
- 94. API with NestJS #94. Deploying multiple instances on AWS with a load balancer
- 95. API with NestJS #95. CI/CD with Amazon ECS and GitHub Actions
- 96. API with NestJS #96. Running unit tests with CI/CD and GitHub Actions
- 97. API with NestJS #97. Introduction to managing logs with Amazon CloudWatch
- 98. API with NestJS #98. Health checks with Terminus and Amazon ECS
- 99. API with NestJS #99. Scaling the number of application instances with Amazon ECS
- 100. API with NestJS #100. The HTTPS protocol with Route 53 and AWS Certificate Manager
- 101. API with NestJS #101. Managing sensitive data using the AWS Secrets Manager
- 102. API with NestJS #102. Writing unit tests with Prisma
- 103. API with NestJS #103. Integration tests with Prisma
- 104. API with NestJS #104. Writing transactions with Prisma
- 105. API with NestJS #105. Implementing soft deletes with Prisma and middleware
- 106. API with NestJS #106. Improving performance through indexes with Prisma
- 107. API with NestJS #107. Offset and keyset pagination with Prisma
- 108. API with NestJS #108. Date and time with Prisma and PostgreSQL
- 109. API with NestJS #109. Arrays with PostgreSQL and Prisma
- 110. API with NestJS #110. Managing JSON data with PostgreSQL and Prisma
- 111. API with NestJS #111. Constraints with PostgreSQL and Prisma
- 112. API with NestJS #112. Serializing the response with Prisma
- 113. API with NestJS #113. Logging with Prisma
- 114. API with NestJS #114. Modifying data using PUT and PATCH methods with Prisma
- 115. API with NestJS #115. Database migrations with Prisma
- 116. API with NestJS #116. REST API versioning
- 117. API with NestJS #117. CORS – Cross-Origin Resource Sharing
- 118. API with NestJS #118. Uploading and streaming videos
- 119. API with NestJS #119. Type-safe SQL queries with Kysely and PostgreSQL
- 120. API with NestJS #120. One-to-one relationships with the Kysely query builder
- 121. API with NestJS #121. Many-to-one relationships with PostgreSQL and Kysely
We should be aware of whether our application is healthy. One way to do that would be to make various API requests to confirm it manually. It might not be the most elegant solution, though. The answer can be health checks. With them, we can verify if various aspects of our system work properly. Creating a health check boils down to exposing an endpoint that tests our application and throws an error if it is unhealthy. Thanks to tools such as Datadog, we can periodically call the health check endpoint to make sure that everything works as expected.
Introducing Terminus
NestJS comes with a tool called Terminus that can help us implement our health check.
|
1 |
npm install @nestjs/terminus |
To use it, we should create a new controller.
health.controller.ts
|
1 2 3 4 5 6 7 8 9 10 11 12 13 14 15 16 17 |
import { Controller, Get } from '@nestjs/common'; import { HealthCheckService, HealthCheck } from '@nestjs/terminus'; @Controller('health') class HealthController { constructor( private health: HealthCheckService, ) {} @Get() @HealthCheck() check() { return this.health.check([]); } } export default HealthController; |
We also need to put it into a module that imports the TerminusModule.
health.module.ts
|
1 2 3 4 5 6 7 8 9 10 |
import { Module } from '@nestjs/common'; import HealthController from './health.controller'; import { TerminusModule } from '@nestjs/terminus'; @Module({ imports: [TerminusModule], controllers: [HealthController], providers: [], }) export default class HealthModule {} |
By doing the above, we achieve a straightforward health check.
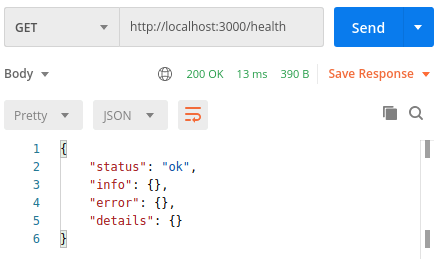
With the above endpoint so far, we can know whether our API started or not. However, it is not much information, so let’s add additional checks.
Using built-in health indicators
Terminus comes with a set of health indicators that can check if a particular service is healthy or not. A good example is the TypeOrmHealthIndicator.
health.controller.ts
|
1 2 3 4 5 6 7 8 9 10 11 12 13 14 15 16 17 18 19 20 |
import { Controller, Get } from '@nestjs/common'; import { HealthCheckService, HealthCheck, TypeOrmHealthIndicator } from '@nestjs/terminus'; @Controller('health') class HealthController { constructor( private healthCheckService: HealthCheckService, private typeOrmHealthIndicator: TypeOrmHealthIndicator, ) {} @Get() @HealthCheck() check() { return this.healthCheckService.check([ () => this.typeOrmHealthIndicator.pingCheck('database') ]); } } export default HealthController; |
Under the hood, the TypeOrmHealthIndicator performs a simple SELECT 1 SQL query to our database to verify that it is up and running and we’ve established a connection. If any of our health indicators fail, the endpoint responds with 503 Service Unavailable instead of 200 OK.
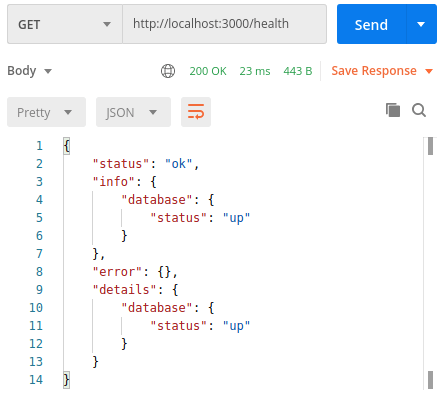
Our /health endpoint responds with a few properties:
- status – if any of our health indicators fail, the status is set to 'error'. If our application is currently shutting down, the status is 'shutting_down'.
- info – contains information about each health indicator that is healthy and has the status 'up',
- error – has information about every health indicator that is unhealthy and has the status 'down',
- details – contains the information about every health indicator that we have.
A list of other built-in health indicators
Terminus has more health indicators that we can use, such as:
-
HttpHealthIndicator
- allows us to perform health checks related to HTTP requests,
-
MongooseHealthIndicator
- with it, we can check if MongoDB responds within 1000ms if we use the Mongoose library (the timeout value can be changed),
-
SequelizeHealthIndicator
- with the Sequelize health indicator, we can execute checks related to Sequelize,
-
MicroserviceHealthIndicator
- allows us to check if a given microservice is up. If you want to know more about microservices, check out API with NestJS #18. Exploring the idea of microservices,
-
GRPCHealthIndicator
- checks if a service is up using the standard health check specification of GRPC. If you want to know more about GRPC, check out API with NestJS #20. Communicating with microservices using the gRPC framework,
-
MemoryHealthIndicator
- performs checks related to memory. Can verify the resident set size (RSS) and the heap space,
-
DiskHealthIndicator
- verifies the disk storage of the machine our application runs on.
Having the above in mind, let’s use more of the built-in health indicators.
health.controller.ts
|
1 2 3 4 5 6 7 8 9 10 11 12 13 14 15 16 17 18 19 20 21 22 23 24 25 26 27 28 29 30 31 32 33 34 35 36 37 |
import { Controller, Get } from '@nestjs/common'; import { HealthCheckService, HealthCheck, TypeOrmHealthIndicator, MemoryHealthIndicator, DiskHealthIndicator, } from '@nestjs/terminus'; @Controller('health') class HealthController { constructor( private healthCheckService: HealthCheckService, private typeOrmHealthIndicator: TypeOrmHealthIndicator, private memoryHealthIndicator: MemoryHealthIndicator, private diskHealthIndicator: DiskHealthIndicator ) {} @Get() @HealthCheck() check() { return this.healthCheckService.check([ () => this.typeOrmHealthIndicator.pingCheck('database'), // the process should not use more than 300MB memory () => this.memoryHealthIndicator.checkHeap('memory heap', 300 * 1024 * 1024), // The process should not have more than 300MB RSS memory allocated () => this.memoryHealthIndicator.checkRSS('memory RSS', 300 * 1024 * 1024), // the used disk storage should not exceed the 50% of the available space () => this.diskHealthIndicator.checkStorage('disk health', { thresholdPercent: 0.5, path: '/' }) ]); } } export default HealthController; |
Custom health indicators
While there are quite a few of the built-in indicators, they are far from covering every case. Thankfully, we can set up a custom health indicator. To do that, we need to extend the HealthIndicator class.
For example, in the 12th part of this series, we’ve used Elasticsearch. Let’s write a health indicator that checks if our instance of Elasticsearch is up and running.
elasticsearchHealthIndicator.ts
|
1 2 3 4 5 6 7 8 9 10 11 12 13 14 15 16 17 18 19 20 21 22 23 24 |
import { Injectable } from '@nestjs/common'; import { HealthIndicator, HealthIndicatorResult, HealthCheckError } from '@nestjs/terminus'; import { ElasticsearchService } from '@nestjs/elasticsearch'; @Injectable() export class ElasticsearchHealthIndicator extends HealthIndicator { constructor( private readonly elasticsearchService: ElasticsearchService ) { super(); } async isHealthy(key: string): Promise<HealthIndicatorResult> { try { await this.elasticsearchService.ping(); return this.getStatus(key, true); } catch (error) { throw new HealthCheckError( 'ElasticsearchHealthIndicator failed', this.getStatus(key, false) ); } } } |
We need to register the ElasticsearchHealthIndicator as a provider before using it.
health.module.ts
|
1 2 3 4 5 6 7 8 9 10 11 12 |
import { Module } from '@nestjs/common'; import HealthController from './health.controller'; import { TerminusModule } from '@nestjs/terminus'; import { ElasticsearchHealthIndicator } from './elasticsearchHealthIndicator'; import { SearchModule } from '../search/search.module'; @Module({ imports: [TerminusModule, SearchModule], controllers: [HealthController], providers: [ElasticsearchHealthIndicator], }) export default class HealthModule {} |
Please notice that I’ve imported the SearchModule that we’ve created in the 12th part of this series.
The last step is to use the ElasticsearchHealthIndicator in our health check:
health.controller.ts
|
1 2 3 4 5 6 7 8 9 10 11 12 13 14 15 16 17 18 19 20 21 22 23 24 25 26 27 28 29 30 31 32 33 34 35 36 37 38 39 40 |
import { Controller, Get } from '@nestjs/common'; import { HealthCheckService, HealthCheck, TypeOrmHealthIndicator, MemoryHealthIndicator, DiskHealthIndicator, } from '@nestjs/terminus'; import { ElasticsearchHealthIndicator } from './elasticsearchHealthIndicator'; @Controller('health') class HealthController { constructor( private healthCheckService: HealthCheckService, private typeOrmHealthIndicator: TypeOrmHealthIndicator, private memoryHealthIndicator: MemoryHealthIndicator, private diskHealthIndicator: DiskHealthIndicator, private elasticsearchHealthIndicator: ElasticsearchHealthIndicator ) {} @Get() @HealthCheck() check() { return this.healthCheckService.check([ () => this.typeOrmHealthIndicator.pingCheck('database'), // the process should not use more than 300MB memory () => this.memoryHealthIndicator.checkHeap('memory heap', 300 * 1024 * 1024), // The process should not have more than 300MB RSS memory allocated () => this.memoryHealthIndicator.checkRSS('memory RSS', 300 * 1024 * 1024), // the used disk storage should not exceed the 50% of the available space () => this.diskHealthIndicator.checkStorage('disk health', { thresholdPercent: 0.5, path: '/' }), () => this.elasticsearchHealthIndicator.isHealthy('elasticsearch') ]); } } export default HealthController; |
Our health check will now check Elasticsearch and verify if it is up and running.
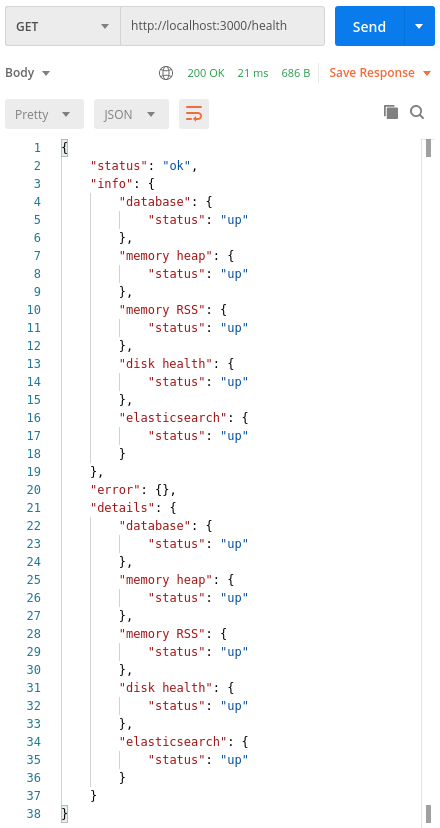
Performing health checks with Datadog
Although the /health endpoint that we’ve created looks useful, we’ve been using it manually so far. Fortunately, there are services such as Datadog that can call this endpoint for us periodically.
To do that, we need to set up an account and create a new synthetic test.
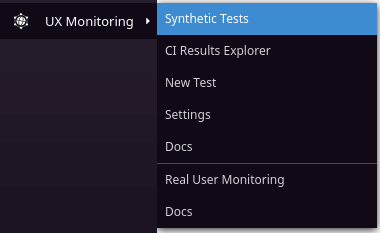
When we’re there, we need to create a new API test.
 If your API isn’t deployed yet, but you want to try the above solution, you can use ngrok to share your localhost API with the world.
When defining our test, we first need to specify the URL of our health check:
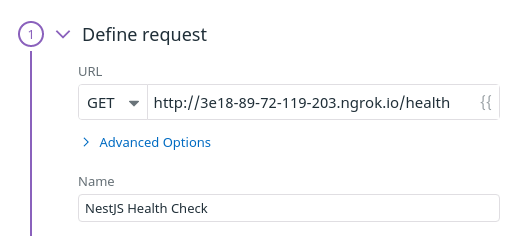
You might want to avoid exposing the health of our application to the outside world and require some kind of authentication to access the /health endpoint for security reasons. If you do that, click Advanced Options where you can provide additional request options.
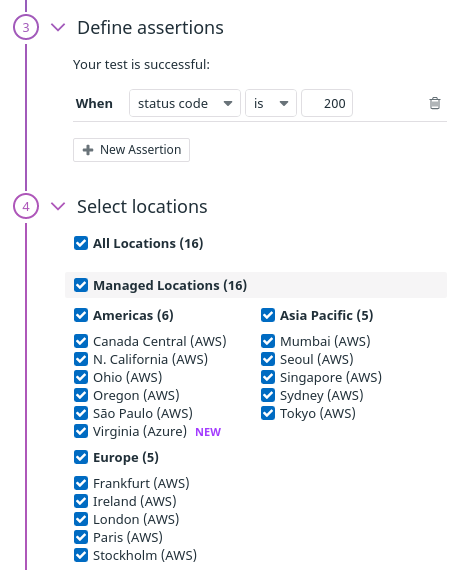
We also need to specify when our test is perceived as successful and what locations we want Datadog to request our API from. Since if any of our health indicators fail, the endpoint responds with 503 Service Unavailable, let’s check if our endpoint responds with 200 OK.
It is also important to specify the frequency of the test and define alert conditions. If something goes wrong, the team can be notified.
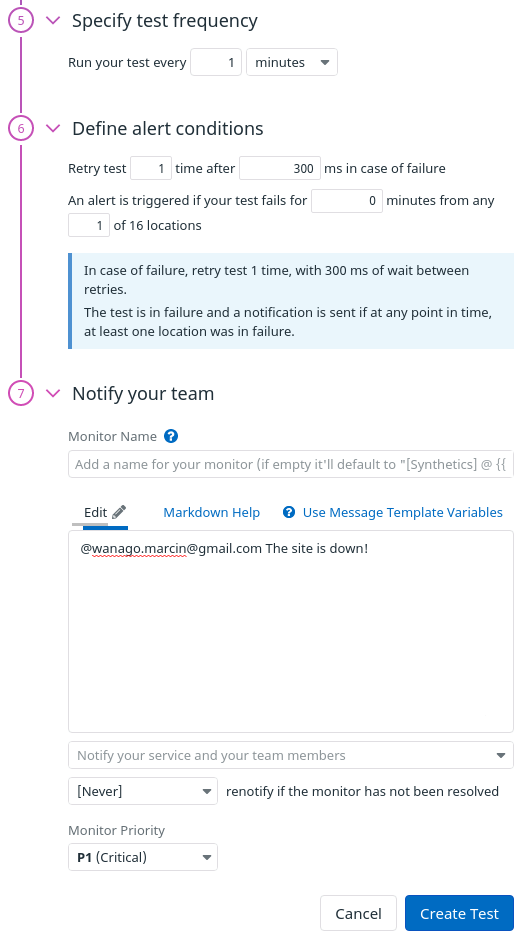
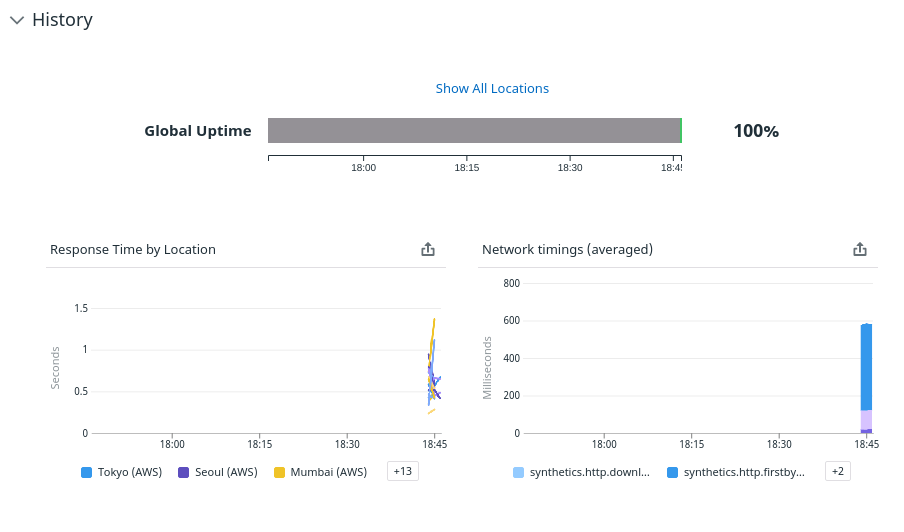
Thanks to doing all of the above, Datadog will monitor our health check endpoint and alert us if something goes wrong. We can also view the history of the tests for more details.
Summary
In this article, we’ve created a health check endpoint with a tool called Terminus. While doing so, we’ve used various health indicators built into NestJS and created a custom one. We’ve set up Datadog to periodically request our health check endpoint and alert us about downtime to benefit from it more.
Health checks are more than just a way to check if our API is up. We can validate the connection to our database or even test its performance to notice potential issues. We should create health checks based on the environment of our application and include services our app depends on. Feel free to write more custom health indicators and fiddle more with Datadog to help you keep your API more reliable and stable.

Pretty cool stuff, thanks for Your work!
In .check([]) we have array with health indicators. Is there any chance to return all failed healthchecks not only first rejected?