- 1. API with NestJS #1. Controllers, routing and the module structure
- 2. API with NestJS #2. Setting up a PostgreSQL database with TypeORM
- 3. API with NestJS #3. Authenticating users with bcrypt, Passport, JWT, and cookies
- 4. API with NestJS #4. Error handling and data validation
- 5. API with NestJS #5. Serializing the response with interceptors
- 6. API with NestJS #6. Looking into dependency injection and modules
- 7. API with NestJS #7. Creating relationships with Postgres and TypeORM
- 8. API with NestJS #8. Writing unit tests
- 9. API with NestJS #9. Testing services and controllers with integration tests
- 10. API with NestJS #10. Uploading public files to Amazon S3
- 11. API with NestJS #11. Managing private files with Amazon S3
- 12. API with NestJS #12. Introduction to Elasticsearch
- 13. API with NestJS #13. Implementing refresh tokens using JWT
- 14. API with NestJS #14. Improving performance of our Postgres database with indexes
- 15. API with NestJS #15. Defining transactions with PostgreSQL and TypeORM
- 16. API with NestJS #16. Using the array data type with PostgreSQL and TypeORM
- 17. API with NestJS #17. Offset and keyset pagination with PostgreSQL and TypeORM
- 18. API with NestJS #18. Exploring the idea of microservices
- 19. API with NestJS #19. Using RabbitMQ to communicate with microservices
- 20. API with NestJS #20. Communicating with microservices using the gRPC framework
- 21. API with NestJS #21. An introduction to CQRS
- 22. API with NestJS #22. Storing JSON with PostgreSQL and TypeORM
- 23. API with NestJS #23. Implementing in-memory cache to increase the performance
- 24. API with NestJS #24. Cache with Redis. Running the app in a Node.js cluster
- 25. API with NestJS #25. Sending scheduled emails with cron and Nodemailer
- 26. API with NestJS #26. Real-time chat with WebSockets
- 27. API with NestJS #27. Introduction to GraphQL. Queries, mutations, and authentication
- 28. API with NestJS #28. Dealing in the N + 1 problem in GraphQL
- 29. API with NestJS #29. Real-time updates with GraphQL subscriptions
- 30. API with NestJS #30. Scalar types in GraphQL
- 31. API with NestJS #31. Two-factor authentication
- 32. API with NestJS #32. Introduction to Prisma with PostgreSQL
- 33. API with NestJS #33. Managing PostgreSQL relationships with Prisma
- 34. API with NestJS #34. Handling CPU-intensive tasks with queues
- 35. API with NestJS #35. Using server-side sessions instead of JSON Web Tokens
- 36. API with NestJS #36. Introduction to Stripe with React
- 37. API with NestJS #37. Using Stripe to save credit cards for future use
- 38. API with NestJS #38. Setting up recurring payments via subscriptions with Stripe
- 39. API with NestJS #39. Reacting to Stripe events with webhooks
- 40. API with NestJS #40. Confirming the email address
- 41. API with NestJS #41. Verifying phone numbers and sending SMS messages with Twilio
- 42. API with NestJS #42. Authenticating users with Google
- 43. API with NestJS #43. Introduction to MongoDB
- 44. API with NestJS #44. Implementing relationships with MongoDB
- 45. API with NestJS #45. Virtual properties with MongoDB and Mongoose
- 46. API with NestJS #46. Managing transactions with MongoDB and Mongoose
- 47. API with NestJS #47. Implementing pagination with MongoDB and Mongoose
- 48. API with NestJS #48. Definining indexes with MongoDB and Mongoose
- 49. API with NestJS #49. Updating with PUT and PATCH with MongoDB and Mongoose
- 50. API with NestJS #50. Introduction to logging with the built-in logger and TypeORM
- 51. API with NestJS #51. Health checks with Terminus and Datadog
- 52. API with NestJS #52. Generating documentation with Compodoc and JSDoc
- 53. API with NestJS #53. Implementing soft deletes with PostgreSQL and TypeORM
- 54. API with NestJS #54. Storing files inside a PostgreSQL database
- 55. API with NestJS #55. Uploading files to the server
- 56. API with NestJS #56. Authorization with roles and claims
- 57. API with NestJS #57. Composing classes with the mixin pattern
- 58. API with NestJS #58. Using ETag to implement cache and save bandwidth
- 59. API with NestJS #59. Introduction to a monorepo with Lerna and Yarn workspaces
- 60. API with NestJS #60. The OpenAPI specification and Swagger
- 61. API with NestJS #61. Dealing with circular dependencies
- 62. API with NestJS #62. Introduction to MikroORM with PostgreSQL
- 63. API with NestJS #63. Relationships with PostgreSQL and MikroORM
- 64. API with NestJS #64. Transactions with PostgreSQL and MikroORM
- 65. API with NestJS #65. Implementing soft deletes using MikroORM and filters
- 66. API with NestJS #66. Improving PostgreSQL performance with indexes using MikroORM
- 67. API with NestJS #67. Migrating to TypeORM 0.3
- 68. API with NestJS #68. Interacting with the application through REPL
- 69. API with NestJS #69. Database migrations with TypeORM
- 70. API with NestJS #70. Defining dynamic modules
- 71. API with NestJS #71. Introduction to feature flags
- 72. API with NestJS #72. Working with PostgreSQL using raw SQL queries
- 73. API with NestJS #73. One-to-one relationships with raw SQL queries
- 74. API with NestJS #74. Designing many-to-one relationships using raw SQL queries
- 75. API with NestJS #75. Many-to-many relationships using raw SQL queries
- 76. API with NestJS #76. Working with transactions using raw SQL queries
- 77. API with NestJS #77. Offset and keyset pagination with raw SQL queries
- 78. API with NestJS #78. Generating statistics using aggregate functions in raw SQL
- 79. API with NestJS #79. Implementing searching with pattern matching and raw SQL
- 80. API with NestJS #80. Updating entities with PUT and PATCH using raw SQL queries
- 81. API with NestJS #81. Soft deletes with raw SQL queries
- 82. API with NestJS #82. Introduction to indexes with raw SQL queries
- 83. API with NestJS #83. Text search with tsvector and raw SQL
- 84. API with NestJS #84. Implementing filtering using subqueries with raw SQL
- 85. API with NestJS #85. Defining constraints with raw SQL
- 86. API with NestJS #86. Logging with the built-in logger when using raw SQL
- 87. API with NestJS #87. Writing unit tests in a project with raw SQL
- 88. API with NestJS #88. Testing a project with raw SQL using integration tests
- 89. API with NestJS #89. Replacing Express with Fastify
- 90. API with NestJS #90. Using various types of SQL joins
- 91. API with NestJS #91. Dockerizing a NestJS API with Docker Compose
- 92. API with NestJS #92. Increasing the developer experience with Docker Compose
- 93. API with NestJS #93. Deploying a NestJS app with Amazon ECS and RDS
- 94. API with NestJS #94. Deploying multiple instances on AWS with a load balancer
- 95. API with NestJS #95. CI/CD with Amazon ECS and GitHub Actions
- 96. API with NestJS #96. Running unit tests with CI/CD and GitHub Actions
- 97. API with NestJS #97. Introduction to managing logs with Amazon CloudWatch
- 98. API with NestJS #98. Health checks with Terminus and Amazon ECS
- 99. API with NestJS #99. Scaling the number of application instances with Amazon ECS
- 100. API with NestJS #100. The HTTPS protocol with Route 53 and AWS Certificate Manager
- 101. API with NestJS #101. Managing sensitive data using the AWS Secrets Manager
- 102. API with NestJS #102. Writing unit tests with Prisma
- 103. API with NestJS #103. Integration tests with Prisma
- 104. API with NestJS #104. Writing transactions with Prisma
- 105. API with NestJS #105. Implementing soft deletes with Prisma and middleware
- 106. API with NestJS #106. Improving performance through indexes with Prisma
- 107. API with NestJS #107. Offset and keyset pagination with Prisma
- 108. API with NestJS #108. Date and time with Prisma and PostgreSQL
- 109. API with NestJS #109. Arrays with PostgreSQL and Prisma
- 110. API with NestJS #110. Managing JSON data with PostgreSQL and Prisma
- 111. API with NestJS #111. Constraints with PostgreSQL and Prisma
- 112. API with NestJS #112. Serializing the response with Prisma
- 113. API with NestJS #113. Logging with Prisma
- 114. API with NestJS #114. Modifying data using PUT and PATCH methods with Prisma
- 115. API with NestJS #115. Database migrations with Prisma
- 116. API with NestJS #116. REST API versioning
- 117. API with NestJS #117. CORS – Cross-Origin Resource Sharing
- 118. API with NestJS #118. Uploading and streaming videos
- 119. API with NestJS #119. Type-safe SQL queries with Kysely and PostgreSQL
- 120. API with NestJS #120. One-to-one relationships with the Kysely query builder
- 121. API with NestJS #121. Many-to-one relationships with PostgreSQL and Kysely
In one of the previous parts of this series, we learned how to use the Elastic Container Service to deploy multiple instances of our application. With this architecture, we maintain the target group, where each target is a single instance of our application. Thanks to that, the load balancer can route a particular API request to one of the registered targets.
Before redirecting the traffic to a particular target, the load balancer must know if the target can handle it. To determine that, the load balancer periodically sends requests to all registered targets to test them. We call those tests health checks. Thanks to performing them, the load balancer redirects the traffic only to the healthy targets.
A common approach is to create a designated endpoint that responds with the status of the application. To create it, we can use the tool called Terminus that NestJS is equipped with.
Using Terminus
Let’s start by installing the Terminus library.
|
1 |
npm install @nestjs/terminus |
To introduce an endpoint using Terminus, we should create a new controller.
health.controller.ts
|
1 2 3 4 5 6 7 8 9 10 11 12 13 14 15 |
import { Controller, Get } from '@nestjs/common'; import { HealthCheckService, HealthCheck } from '@nestjs/terminus'; @Controller('health') class HealthController { constructor(private healthCheckService: HealthCheckService) {} @Get() @HealthCheck() check() { return this.healthCheckService.check([]); } } export default HealthController; |
The @HealthCheck() decorator is optional. As we can see under the hood, it allows for integrating Terminus with Swagger.
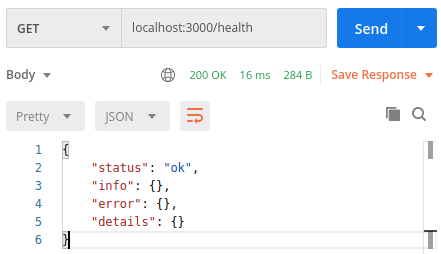
The most important thing above is the healthCheckService.check method. The code we have so far gives us a straightforward health check.
Built-in health indicators
We can perform more advanced checks using the health indicators built into NestJS. With them, we can verify a particular aspect of our application.
A very good example is the TypeOrmHealthIndicator. Under the hood, it performs a simple SELECT SQL query to verify that our database is up and running. Doing that also ensures we’ve established a connection successfully.
There is also the MikroOrmHealthIndicator, SequelizeHealthIndicator, and MongooseHealthIndicator if you are using some other ORM than TypeORM.
health.controller.ts
|
1 2 3 4 5 6 7 8 9 10 11 12 13 14 15 16 17 18 19 20 21 22 23 24 |
import { Controller, Get } from '@nestjs/common'; import { HealthCheckService, HealthCheck, TypeOrmHealthIndicator, } from '@nestjs/terminus'; @Controller('health') class HealthController { constructor( private healthCheckService: HealthCheckService, private typeOrmHealthIndicator: TypeOrmHealthIndicator, ) {} @Get() @HealthCheck() check() { return this.healthCheckService.check([ () => this.typeOrmHealthIndicator.pingCheck('database'), ]); } } export default HealthController; |
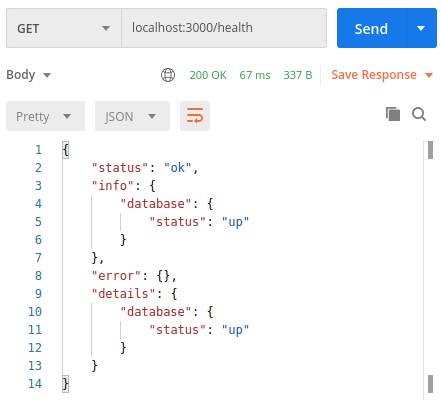
The healthCheckService.check method responds with a few properties:
-
status
- if all of our health indicators report success, it equals ok. Otherwise, it can be shutting_down or an error. If the status is not ok, the endpoint responds with 503 Service Unavailable instead of 200 OK.
-
info
- has data about each healthy indicator
-
error
- contains information about every unhealthy indicator
-
details
- has data about every indicator
Terminus offers more health indicators than just those related to the database:
-
HttpHealthIndicator
- allows us to make an HTTP request and verify if it’s working as expected
-
MemoryHealthIndicator
- verifies if the process does not exceed a specific memory limit
-
DiskHealthIndicator
- checks how much storage our application uses
-
MicroserviceHealthIndicator
- ensures a given microservice is up. To learn more about microservices, check out API with NestJS #18. Exploring the idea of microservices,
-
GRPCHealthIndicator
- verifies if a service is working as expected using the standard health check specification of GRPC.
Custom health indicators
The above list contains health indicators for various ORMs. However, in some parts of this series, we’ve worked with raw SQL without any ORM.
Fortunately, we can set up a custom health indicator. To do that, we need to extend the HealthIndicator class.
databaseHealthIndicator.ts
|
1 2 3 4 5 6 7 8 9 10 11 12 13 14 15 16 17 18 19 20 21 22 23 24 25 26 27 28 |
import { Injectable } from '@nestjs/common'; import { HealthIndicator, HealthIndicatorResult, HealthCheckError, } from '@nestjs/terminus'; import DatabaseService from '../database/database.service'; @Injectable() class DatabaseHealthIndicator extends HealthIndicator { constructor(private readonly databaseService: DatabaseService) { super(); } async isHealthy(): Promise<HealthIndicatorResult> { try { await this.databaseService.runQuery('SELECT 1'); return this.getStatus('database', true); } catch (error) { throw new HealthCheckError( 'DatabaseHealthIndicator failed', this.getStatus('database', false), ); } } } export default DatabaseHealthIndicator; |
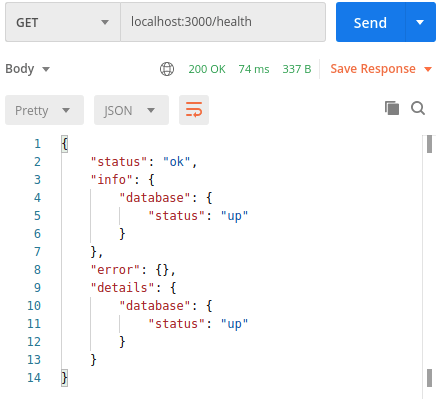
The this.getStatus method generates the health indicator result that ends up in the info, error, and details objects.
To include it, we must call our new isHealthy method in the HealthController.
health.controller.ts
|
1 2 3 4 5 6 7 8 9 10 11 12 13 14 15 16 17 18 19 20 21 |
import { Controller, Get } from '@nestjs/common'; import { HealthCheckService, HealthCheck } from '@nestjs/terminus'; import DatabaseHealthIndicator from './databaseHealthIndicator'; @Controller('health') class HealthController { constructor( private healthCheckService: HealthCheckService, private databaseHealthIndicator: DatabaseHealthIndicator, ) {} @Get() @HealthCheck() check() { return this.healthCheckService.check([ () => this.databaseHealthIndicator.isHealthy(), ]); } } export default HealthController; |
Setting the health check with AWS
We need to point the load balancer to our /health endpoint. We do that when setting up the load balancer while starting tasks in our Elastic Container Service cluster.
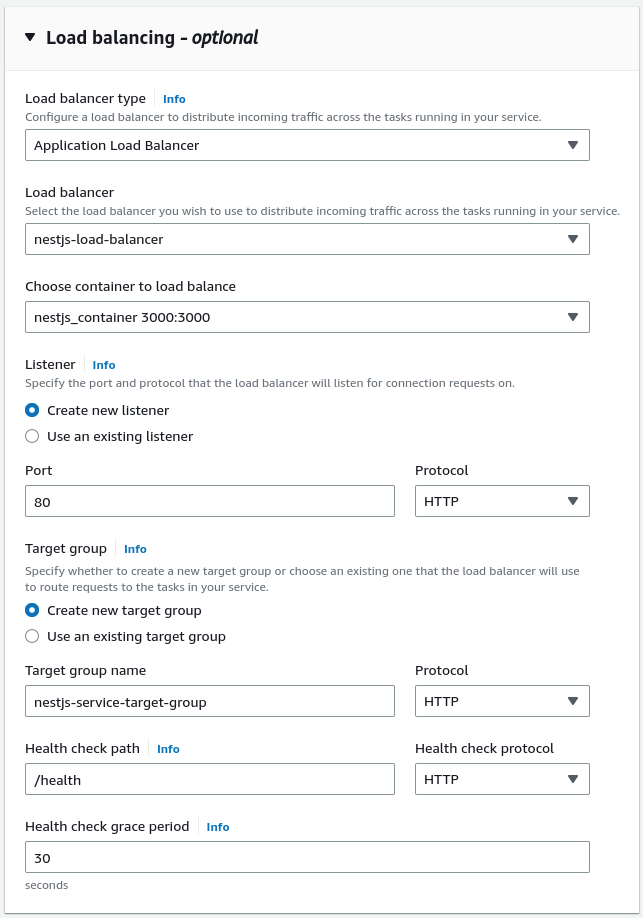
Above, when creating the target group for our cluster, we specify /health as the health check path. Thanks to that, the load balancer periodically sends requests to the /health endpoint to determine if a particular instance of our NestJS application is working as expected.
If our task takes a long time to start, the load balancer might mark it as unhealthy and shut it down. We can prevent that by setting up the health check grace period in the above form. This gives our tasks additional time to reach a healthy state.
Verifying if our tasks are running
In the previous part of this series, we learned how to manage logs with Amazon CloudWatch. We also created the LoggerInterceptor that logs every endpoint requested in our API.
Let’s look at the logs to verify if the load balancer requests our /health endpoint.
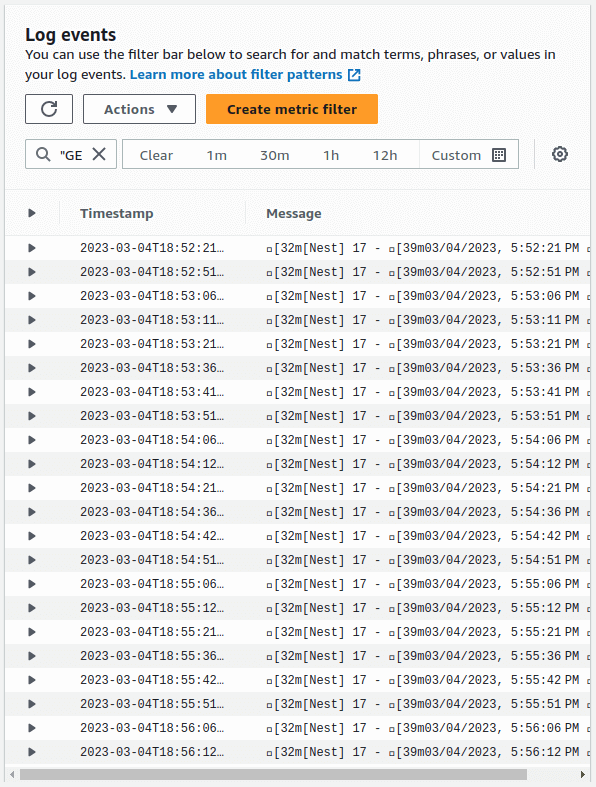
It’s also worth looking at the “Health and metrics” tab on the page dedicated to the service running our tasks.
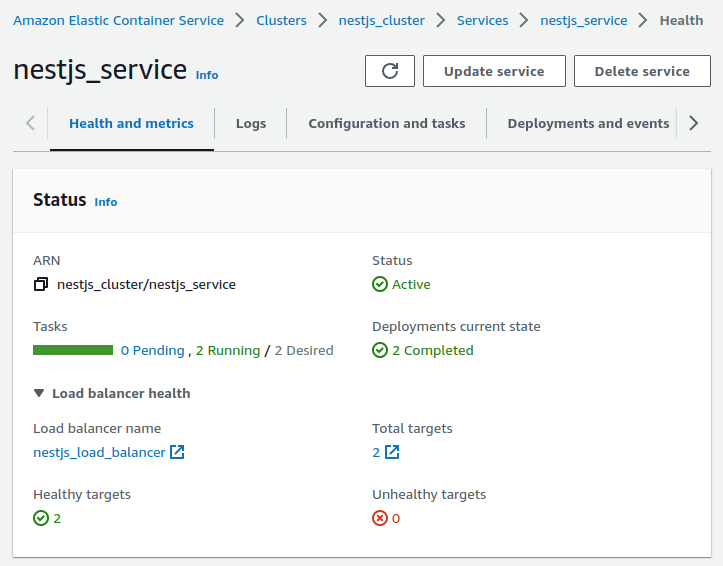
If no target is healthy, the load balancer cannot handle the incoming traffic. So if our application does not work, it’s one of the first things to check when debugging.
It’s also worth looking at the “Deployment and events” tab. If something goes wrong with our deployment, the issue will often be visible in the “events” table.
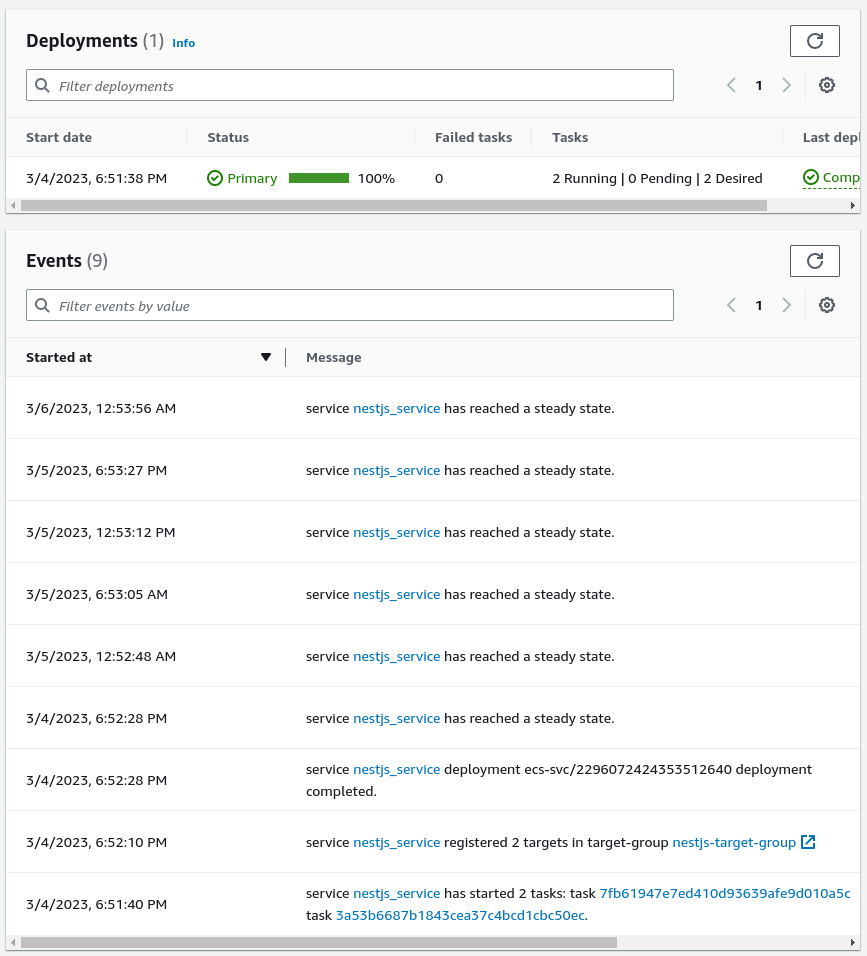
Summary
In this article, we learned what health checks are and how to design them. We also used them together with Amazon Elastic Container Service to verify if the instances of our NestJS application were running correctly. While doing so, we’ve learned more about debugging our NestJS app running with AWS and why we need to care about the health of our tasks running in the cluster.
There is still more to learn about running NestJS with AWS, so stay tuned!
