- 1. API with NestJS #1. Controllers, routing and the module structure
- 2. API with NestJS #2. Setting up a PostgreSQL database with TypeORM
- 3. API with NestJS #3. Authenticating users with bcrypt, Passport, JWT, and cookies
- 4. API with NestJS #4. Error handling and data validation
- 5. API with NestJS #5. Serializing the response with interceptors
- 6. API with NestJS #6. Looking into dependency injection and modules
- 7. API with NestJS #7. Creating relationships with Postgres and TypeORM
- 8. API with NestJS #8. Writing unit tests
- 9. API with NestJS #9. Testing services and controllers with integration tests
- 10. API with NestJS #10. Uploading public files to Amazon S3
- 11. API with NestJS #11. Managing private files with Amazon S3
- 12. API with NestJS #12. Introduction to Elasticsearch
- 13. API with NestJS #13. Implementing refresh tokens using JWT
- 14. API with NestJS #14. Improving performance of our Postgres database with indexes
- 15. API with NestJS #15. Defining transactions with PostgreSQL and TypeORM
- 16. API with NestJS #16. Using the array data type with PostgreSQL and TypeORM
- 17. API with NestJS #17. Offset and keyset pagination with PostgreSQL and TypeORM
- 18. API with NestJS #18. Exploring the idea of microservices
- 19. API with NestJS #19. Using RabbitMQ to communicate with microservices
- 20. API with NestJS #20. Communicating with microservices using the gRPC framework
- 21. API with NestJS #21. An introduction to CQRS
- 22. API with NestJS #22. Storing JSON with PostgreSQL and TypeORM
- 23. API with NestJS #23. Implementing in-memory cache to increase the performance
- 24. API with NestJS #24. Cache with Redis. Running the app in a Node.js cluster
- 25. API with NestJS #25. Sending scheduled emails with cron and Nodemailer
- 26. API with NestJS #26. Real-time chat with WebSockets
- 27. API with NestJS #27. Introduction to GraphQL. Queries, mutations, and authentication
- 28. API with NestJS #28. Dealing in the N + 1 problem in GraphQL
- 29. API with NestJS #29. Real-time updates with GraphQL subscriptions
- 30. API with NestJS #30. Scalar types in GraphQL
- 31. API with NestJS #31. Two-factor authentication
- 32. API with NestJS #32. Introduction to Prisma with PostgreSQL
- 33. API with NestJS #33. Managing PostgreSQL relationships with Prisma
- 34. API with NestJS #34. Handling CPU-intensive tasks with queues
- 35. API with NestJS #35. Using server-side sessions instead of JSON Web Tokens
- 36. API with NestJS #36. Introduction to Stripe with React
- 37. API with NestJS #37. Using Stripe to save credit cards for future use
- 38. API with NestJS #38. Setting up recurring payments via subscriptions with Stripe
- 39. API with NestJS #39. Reacting to Stripe events with webhooks
- 40. API with NestJS #40. Confirming the email address
- 41. API with NestJS #41. Verifying phone numbers and sending SMS messages with Twilio
- 42. API with NestJS #42. Authenticating users with Google
- 43. API with NestJS #43. Introduction to MongoDB
- 44. API with NestJS #44. Implementing relationships with MongoDB
- 45. API with NestJS #45. Virtual properties with MongoDB and Mongoose
- 46. API with NestJS #46. Managing transactions with MongoDB and Mongoose
- 47. API with NestJS #47. Implementing pagination with MongoDB and Mongoose
- 48. API with NestJS #48. Definining indexes with MongoDB and Mongoose
- 49. API with NestJS #49. Updating with PUT and PATCH with MongoDB and Mongoose
- 50. API with NestJS #50. Introduction to logging with the built-in logger and TypeORM
- 51. API with NestJS #51. Health checks with Terminus and Datadog
- 52. API with NestJS #52. Generating documentation with Compodoc and JSDoc
- 53. API with NestJS #53. Implementing soft deletes with PostgreSQL and TypeORM
- 54. API with NestJS #54. Storing files inside a PostgreSQL database
- 55. API with NestJS #55. Uploading files to the server
- 56. API with NestJS #56. Authorization with roles and claims
- 57. API with NestJS #57. Composing classes with the mixin pattern
- 58. API with NestJS #58. Using ETag to implement cache and save bandwidth
- 59. API with NestJS #59. Introduction to a monorepo with Lerna and Yarn workspaces
- 60. API with NestJS #60. The OpenAPI specification and Swagger
- 61. API with NestJS #61. Dealing with circular dependencies
- 62. API with NestJS #62. Introduction to MikroORM with PostgreSQL
- 63. API with NestJS #63. Relationships with PostgreSQL and MikroORM
- 64. API with NestJS #64. Transactions with PostgreSQL and MikroORM
- 65. API with NestJS #65. Implementing soft deletes using MikroORM and filters
- 66. API with NestJS #66. Improving PostgreSQL performance with indexes using MikroORM
- 67. API with NestJS #67. Migrating to TypeORM 0.3
- 68. API with NestJS #68. Interacting with the application through REPL
- 69. API with NestJS #69. Database migrations with TypeORM
- 70. API with NestJS #70. Defining dynamic modules
- 71. API with NestJS #71. Introduction to feature flags
- 72. API with NestJS #72. Working with PostgreSQL using raw SQL queries
- 73. API with NestJS #73. One-to-one relationships with raw SQL queries
- 74. API with NestJS #74. Designing many-to-one relationships using raw SQL queries
- 75. API with NestJS #75. Many-to-many relationships using raw SQL queries
- 76. API with NestJS #76. Working with transactions using raw SQL queries
- 77. API with NestJS #77. Offset and keyset pagination with raw SQL queries
- 78. API with NestJS #78. Generating statistics using aggregate functions in raw SQL
- 79. API with NestJS #79. Implementing searching with pattern matching and raw SQL
- 80. API with NestJS #80. Updating entities with PUT and PATCH using raw SQL queries
- 81. API with NestJS #81. Soft deletes with raw SQL queries
- 82. API with NestJS #82. Introduction to indexes with raw SQL queries
- 83. API with NestJS #83. Text search with tsvector and raw SQL
- 84. API with NestJS #84. Implementing filtering using subqueries with raw SQL
- 85. API with NestJS #85. Defining constraints with raw SQL
- 86. API with NestJS #86. Logging with the built-in logger when using raw SQL
- 87. API with NestJS #87. Writing unit tests in a project with raw SQL
- 88. API with NestJS #88. Testing a project with raw SQL using integration tests
- 89. API with NestJS #89. Replacing Express with Fastify
- 90. API with NestJS #90. Using various types of SQL joins
- 91. API with NestJS #91. Dockerizing a NestJS API with Docker Compose
- 92. API with NestJS #92. Increasing the developer experience with Docker Compose
- 93. API with NestJS #93. Deploying a NestJS app with Amazon ECS and RDS
- 94. API with NestJS #94. Deploying multiple instances on AWS with a load balancer
- 95. API with NestJS #95. CI/CD with Amazon ECS and GitHub Actions
- 96. API with NestJS #96. Running unit tests with CI/CD and GitHub Actions
- 97. API with NestJS #97. Introduction to managing logs with Amazon CloudWatch
- 98. API with NestJS #98. Health checks with Terminus and Amazon ECS
- 99. API with NestJS #99. Scaling the number of application instances with Amazon ECS
- 100. API with NestJS #100. The HTTPS protocol with Route 53 and AWS Certificate Manager
- 101. API with NestJS #101. Managing sensitive data using the AWS Secrets Manager
- 102. API with NestJS #102. Writing unit tests with Prisma
- 103. API with NestJS #103. Integration tests with Prisma
- 104. API with NestJS #104. Writing transactions with Prisma
- 105. API with NestJS #105. Implementing soft deletes with Prisma and middleware
- 106. API with NestJS #106. Improving performance through indexes with Prisma
- 107. API with NestJS #107. Offset and keyset pagination with Prisma
- 108. API with NestJS #108. Date and time with Prisma and PostgreSQL
- 109. API with NestJS #109. Arrays with PostgreSQL and Prisma
- 110. API with NestJS #110. Managing JSON data with PostgreSQL and Prisma
- 111. API with NestJS #111. Constraints with PostgreSQL and Prisma
- 112. API with NestJS #112. Serializing the response with Prisma
- 113. API with NestJS #113. Logging with Prisma
- 114. API with NestJS #114. Modifying data using PUT and PATCH methods with Prisma
- 115. API with NestJS #115. Database migrations with Prisma
- 116. API with NestJS #116. REST API versioning
- 117. API with NestJS #117. CORS – Cross-Origin Resource Sharing
- 118. API with NestJS #118. Uploading and streaming videos
- 119. API with NestJS #119. Type-safe SQL queries with Kysely and PostgreSQL
- 120. API with NestJS #120. One-to-one relationships with the Kysely query builder
- 121. API with NestJS #121. Many-to-one relationships with PostgreSQL and Kysely
In this series, we’ve learned how to use the logger built into NestJS. In this article, we learn how to manage the logs our NestJS application produces using Amazon CloudWatch.
In this article, we assume you’re familiar with deploying NestJS applications using Amazon Elastic Constainer Service. If you want to know more about this topic, check out the following articles:
Improving the way we deploy with CI/CD
In one of the recent parts of this series, we learned how to deploy our NestJS application automatically every time there are new changes in the master branch of our repository.
To do that, we configured GitHub Actions in the following way:
|
1 2 3 |
- name: Update ECS service run: | aws ecs update-service --cluster nest_cluster --service nestjs_service --task-definition nest_task --force-new-deployment |
The downside is that it forces us to always use the exact name of the AWS cluster, service, and task definition. Fortunately, we can quickly improve that using environment variables.
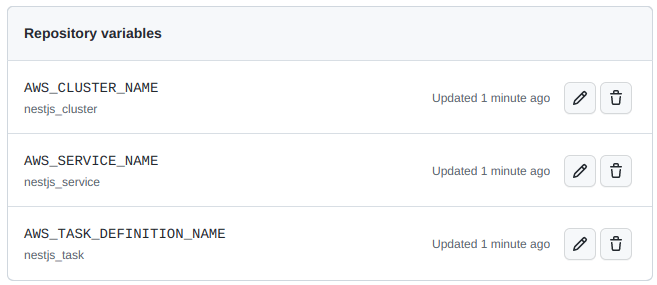
First, we need to go to the settings of our GitHub repository and open the Variables tab on the Secrets and Variables page. There, we need to add three variables:
- AWS_CLUSTER_NAME
- AWS_SERVICE_NAME
- AWS_TASK_DEFINITION_NAME

Now, we can modify the GitHub Actions configuration and use our variables through the vars property.
|
1 2 3 4 5 6 7 |
- name: Update ECS service run: | aws ecs update-service \ --cluster ${{ vars.AWS_CLUSTER_NAME }} \ --service ${{ vars.AWS_SERVICE_NAME }} \ --task-definition ${{ vars.AWS_TASK_DEFINITION_NAME }} \ --force-new-deployment |
Thanks to doing the above, we can effortlessly change the cluster, service, and task definition without changing our GitHub Actions configuration.
Adding logging to our NestJS application
When we deploy our application, people start using it and depending on it. Therefore, it’s crucial to have mechanisms that help us monitor it and ensure it’s working as expected. One of them is the feature of storing and accessing the logs.
The most straightforward logging we can implement in a NestJS application includes printing information about clients calling our API. To implement it, let’s create an interceptor.
logger.interceptor.ts
|
1 2 3 4 5 6 7 8 9 10 11 12 13 14 15 16 17 18 19 20 21 22 23 24 25 26 27 28 29 30 31 32 33 34 35 36 37 38 |
import { Injectable, NestInterceptor, ExecutionContext, CallHandler, Logger, } from '@nestjs/common'; import { Request, Response } from 'express'; @Injectable() export class LoggerInterceptor implements NestInterceptor { private readonly logger = new Logger('HTTP'); intercept(context: ExecutionContext, next: CallHandler) { const httpContext = context.switchToHttp(); const request = httpContext.getRequest<Request>(); const response = httpContext.getResponse<Response>(); response.on('finish', () => { const { method, originalUrl } = request; const { statusCode, statusMessage } = response; const message = `${method} ${originalUrl} ${statusCode} ${statusMessage}`; if (statusCode >= 500) { return this.logger.error(message); } if (statusCode >= 400) { return this.logger.warn(message); } return this.logger.log(message); }); return next.handle(); } } |
If you want to know more about the logger built into NestJS and how the above interceptor works, check out the following articles:
To use our interceptor in all our endpoints, we need to add it to our bootstrap function.
|
1 2 3 4 5 6 7 8 9 10 11 12 13 14 15 16 17 18 19 20 21 22 23 24 25 26 27 28 29 30 31 |
import { NestFactory } from '@nestjs/core'; import { AppModule } from './app.module'; import * as cookieParser from 'cookie-parser'; import { LogLevel, ValidationPipe } from '@nestjs/common'; import { ConfigService } from '@nestjs/config'; import { LoggerInterceptor } from './utils/logger.interceptor'; async function bootstrap() { const isProduction = process.env.NODE_ENV === 'production'; const logLevels: LogLevel[] = isProduction ? ['error', 'warn', 'log'] : ['error', 'warn', 'log', 'verbose', 'debug']; const app = await NestFactory.create(AppModule, { logger: logLevels, }); const configService = app.get(ConfigService); app.useGlobalPipes( new ValidationPipe({ transform: true, }), ); app.use(cookieParser()); app.useGlobalInterceptors(new LoggerInterceptor()); await app.listen(configService.get('PORT')); } bootstrap(); |
When we do that, our NestJS application logs a message every time someone uses our API.
[NestApplication] Nest application successfully started +3ms
[HTTP] GET /posts 200 OK
Introducing Amazon CloudWatch
AWS includes the Amazon CloudWatch service that we can use to monitor our applications. With it, we can collect and visualize real-time logs and metrics through the AWS dashboard.
In the previous parts of this series, we created a task definition that describes how a docker container should launch in our cluster. We can modify it slightly to set up logs with CloudWatch.
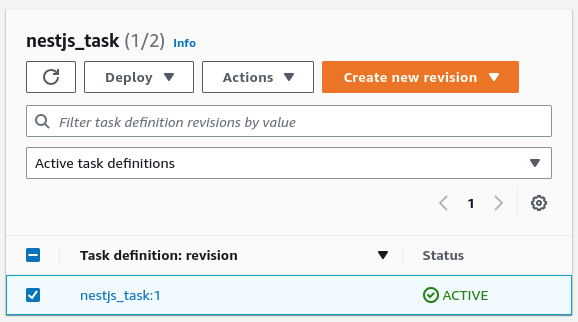
To do that, let’s open the existing task definition, select the latest revision, and click “Create new revision”.

A straightforward way of reaching the necessary interface is switching off the “New ECS Experience” in the top left corner.

We now need to scroll down to the definition of our container.

When we click on the name of our container, a popup appears. When we scroll down to the “Storage and logging” section, we can find the log configuration.

The “awslogs” driver
When using Elastic Container Service, we run our Docker images on machines operating with Linux. To handle input, output, and error messages, Linux uses data streams:
- standard output – stdout
- standard error – stderr
- standard input – stdin
Whenever we use console.log, Node.js uses stdout to print the message to our terminal. When we use the console.error function, Node.js writes to the stderr data stream. When we look under the hood of NestJS and its logger implementation, it also uses the stdout and stderr data streams by default.
When we check the “Auto-configure CloudWatch Logs” checkbox, AWS sets us up with the awslogs driver. It passes the stdout and stderr data streams from Docker to CloudWatch logs. Thanks to that, we don’t need to configure anything else.
When we create a task using a task definition configured to use CloudWatch, AWS creates a log stream for us. A log stream is a sequence of logs originating from the same source. Each log source in CloudWatch creates a separate log stream.
A log group is a collection of log streams. When we checked the “Auto-configure CloudWatch Logs” checkbox in our configuration, AWS associated our log stream with a particular log group. This log group is tied to our task definition.
![]()
Viewing the logs
As soon as our application runs, the data starts flowing in. There are a few ways to view it.
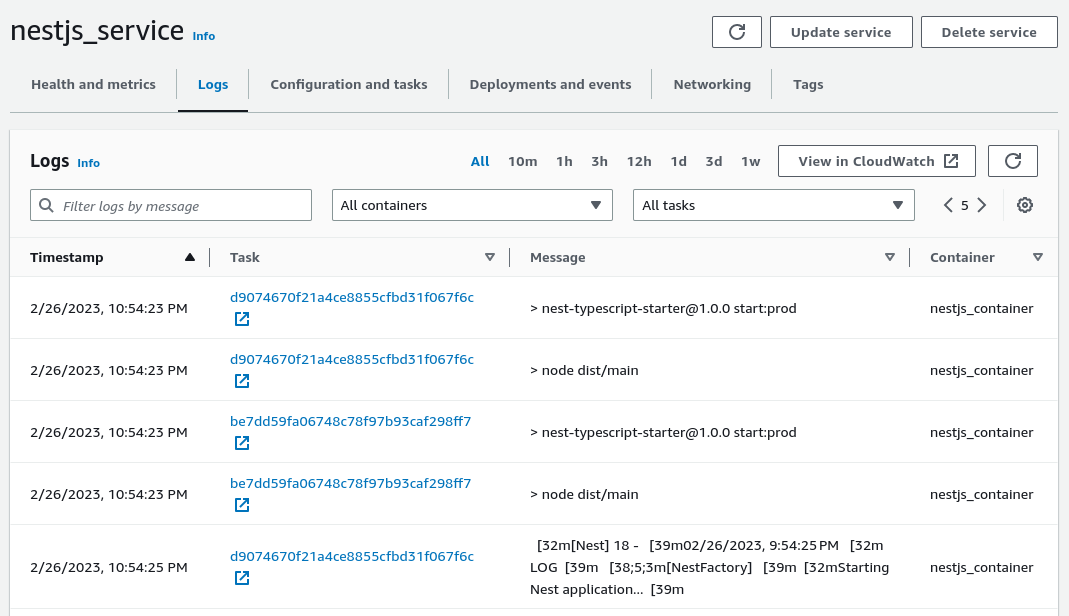
Firstly, we can go to the Elastic Container Service, open the service our task runs in, and go to the “Logs” tab.

In API with NestJS #94. Deploying multiple instances on AWS with a load balancer, we’ve learned how to deploy multiple instances of our application. Because of that, we can see numerous log sources in the above screenshot.
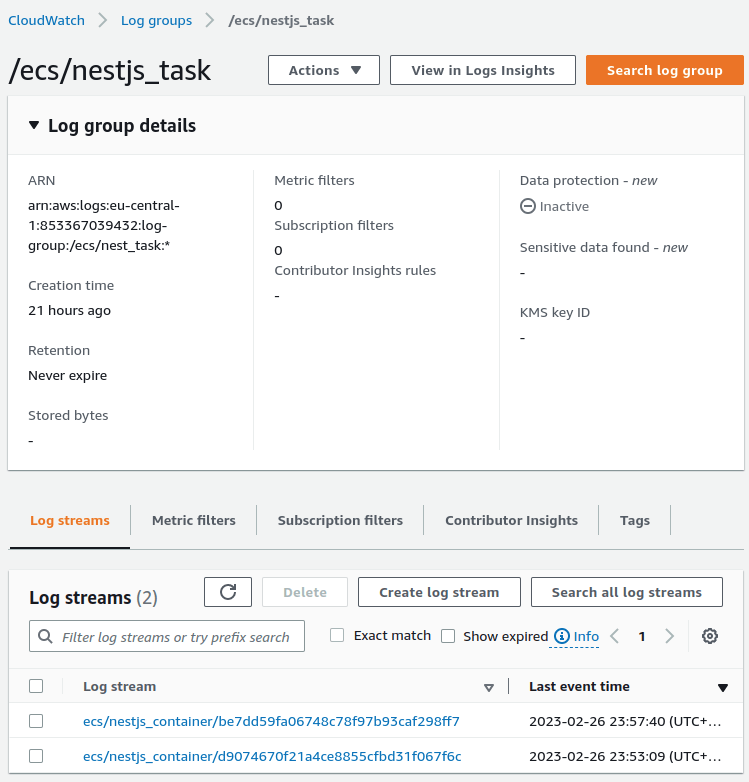
An alternative to the above approach to viewing logs is to open the CloudWatch dashboard and go to the log groups page.

On the above page, we can open a particular log group associated with our task definition. When we do that, we have the access to log streams of specific instances of our application.

Let’s open one of our streams and verify if our LoggerInterceptor works by providing a filter pattern.

Summary
In this article, we’ve gone through the basics of how CloudWatch works and how to use it for logging. To do that, we’ve added a logging interceptor to our NestJS application and configured the awslogs driver in our task definition. We’ve also explained the data streams in Linux and how they affect the awslogs driver. Finally, to confirm that our logging interceptor is working as expected, we’ve opened the CloudWatch driver and used an appropriate filter pattern to find the desired logs.
There are more ways to take advantage of the CloudWatch service when working with NestJS applications, so stay tuned!
