The User Experience might be a bit subjective and hard to measure, but there are some parts of it that we can assess. In this article, we explore the User Timing API. With it, we can care for the performance of our applications even more. With a clear determinant of how the features that we implement affect the speed of our page, we can make a more vivid impression on our users. We can also avoid the degradation of the performance when modifying existing code. By browsing various statistics, we can find out that caring for low latency plays a vital role in how successful the business is.
Some time back, we did audits with the Lighthouse. Factors like First Contentful Paint and the Speed Index can give you an overall grasp of how the application is performing. With User Timing API, we can do more precise measurements. As seen on caniuse.com, it is broadly supported in both desktop and mobile browsers.
The basics of the User Timing API
The User Timing API allows us to create timestamps and make them a part of the performance timeline that we can observe in the Developer Tools.
Creating performance marks
The first performance event type that we look into is a mark. They can be set in any location in our application. To do it, we use the mark() function from the global Performance object. It takes one argument, which is the name of the mark.
In order to emulate the passage of time, in this article, we create a wait function. To get a better grasp of it, check out Explaining promises and callbacks while implementing a sorting algorithm
|
1 2 3 4 5 6 7 |
const wait = time => ( new Promise(resolve => { setTimeout(() => { resolve(); }, time) }) ) |
|
1 2 3 4 5 6 |
performance.mark('Page loaded'); wait(1000) .then(() => { performance.mark('Some time passed'); }); |
With the code above, we create instances of the PerformanceEntries. Such objects consist of single performance metrics and have the following properties:
- name
it is a string that we passed to the mark() function - entryType
when we use the User Timing API, it can be either a mark or a measure - startTime
represents the starting time for the performance metric. It returns a DOMHighResTimeStamp – here, it represents the time since the browser context was created - duration
when we create a mark, it equals zero
We can look up all of the above properties using the performance.getEntriesByType('mark') function.
|
1 2 3 4 5 6 7 8 9 10 11 12 13 14 |
[ { "name": "Page loaded", "entryType": "mark", "startTime": 383.5200000030454, "duration": 0 }, { "name": "Some time passed", "entryType": "mark", "startTime": 1383.8350000005448, "duration": 0 } ] |
We can also remove marks if we desire by calling the performance.clearMarks(name) function. It removes all marks if not provided with a name.
Creating performance measures
Performance measures represent the passage of time between two marks. We can use performance.measure() function to create a measure.
|
1 2 3 4 5 6 |
performance.mark('Page loaded'); wait(1000) .then(() => { performance.mark('Some time passed'); performance.measure('Benchmark', 'Page loaded', 'Some time passed'); }); |
Measures also implement the PerformanceEntry interface and therefore have the same properties. This time it has a meaningful duration that represents the end mark minus the start mark.
|
1 |
performance.getEntriesByType('measure'); |
|
1 2 3 4 5 6 7 8 |
[ { "name": "Benchmark", "entryType": "measure", "startTime": 444.99500000165426, "duration": 1000.4049999988638 } ] |
Running setTimeout with 1000 miliseconds does not cause the application to wait precisely one second. If you want to know more about Event Loop and why the above happens, check out When async is just not enough. An introduction to multithreading in the browser
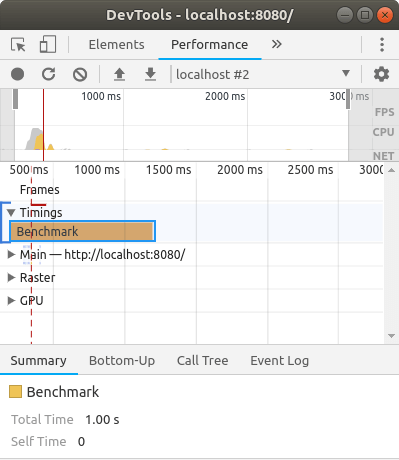
The interesting thing is that we can look up the measure that we created in the Performance tab in the Developer Tools.

There are more methods that we can use to retrieve either the measures or the marks. By running performance.getEntries() we get all entries. When we run performance.getEntriesByName(name, entryType) we get an entry with a specified name and entry type.
Examples of measuring the User Experience
The good thing about User Timing API is that we can use it to measure our product. When wondering what can be a proper way to do that, it might be a good idea to take a closer look at some existing solutions. The first example is the Time To First Tweet. It is defined by Twitter and measures how soon the first Tweet on a page is visible. Their priority was to display meaningful content as fast as possible. In their case, it is a first tweet.
Pinterest implemented a slightly more sophisticated approach. For every major feature on the site, they defined a metric called Pinner Wait Time. It represents the time between initiating an action – for example, clicking a Pin – to an action being completed. They also put an emphasis on preventing regressions when adding new features. You can read about it on their Pinterest Engineering Blog.
Summary
In this article, we’ve gone through the features of the User Timing API. We’ve learned how to use it and how to look into the results both in the Developer Tools and through the code. By doing so, we can take better care of the User Experience of our application. Thanks to the crucial parts of our app performing better, the users are more eager to use it. Also, it is a good way to avoid regressions in our code from the performance perspective.
